The Real-Time Lakehouse with Streaming and Iceberg
The real-time lakehouse is not one engine. It is a contract between streams, table commits, query paths, and freshness expectations. For data engineers connecting streaming systems to lakehouse analytics, the useful question is what changes in production and what simply sounds current.
A Live Event Loop Is Only Useful If the Platform Can Explain What It Knows and When
A live event loop is only useful if the platform can explain which data is fresh, which data is durable, and which query path was used.
The useful test is practical: can a team explain the behavior, measure the outcome, and recover when something breaks? That matters because the real-time lakehouse is a design pattern that requires clarity about two different clocks. The stream clock describes when events arrive. The table clock describes when committed snapshots become visible for analytical queries. Some use cases need immediate event processing. Others need durable, queryable state. The design should name which clock matters for each decision before the platform is built.
The contracts that already mattered now matter more. Commit frequency, snapshot visibility, small-file accumulation, and freshness expectations have to be explicit enough for both people and software to rely on them.
What the Docs Support
The strongest public sources for this topic are the Apache Iceberg specification, Apache Flink documentation, and Apache Kafka documentation. I use those to ground the architecture and avoid treating every June 2026 announcement as a shipped production capability.
The evidence supports a few grounded points:
- Streaming ingestion and table storage solve different parts of the freshness problem.
- Iceberg snapshots provide durable analytical state, but commit frequency and file layout affect query behavior.
- Real-time agent loops need low latency, quality checks, and explicit action boundaries.
That is enough to write a useful technical article. It is not enough to make sweeping claims. I separate released behavior, design direction, and market language because readers can work with careful distinctions. They cannot operate slogans.
The Architecture Pattern
The real-time lakehouse has at least two clocks. The stream clock describes when events arrive. The table clock describes when committed snapshots become visible for analytical queries. Some use cases need immediate event processing. Others need durable, queryable state. The design should name which clock matters for each decision.
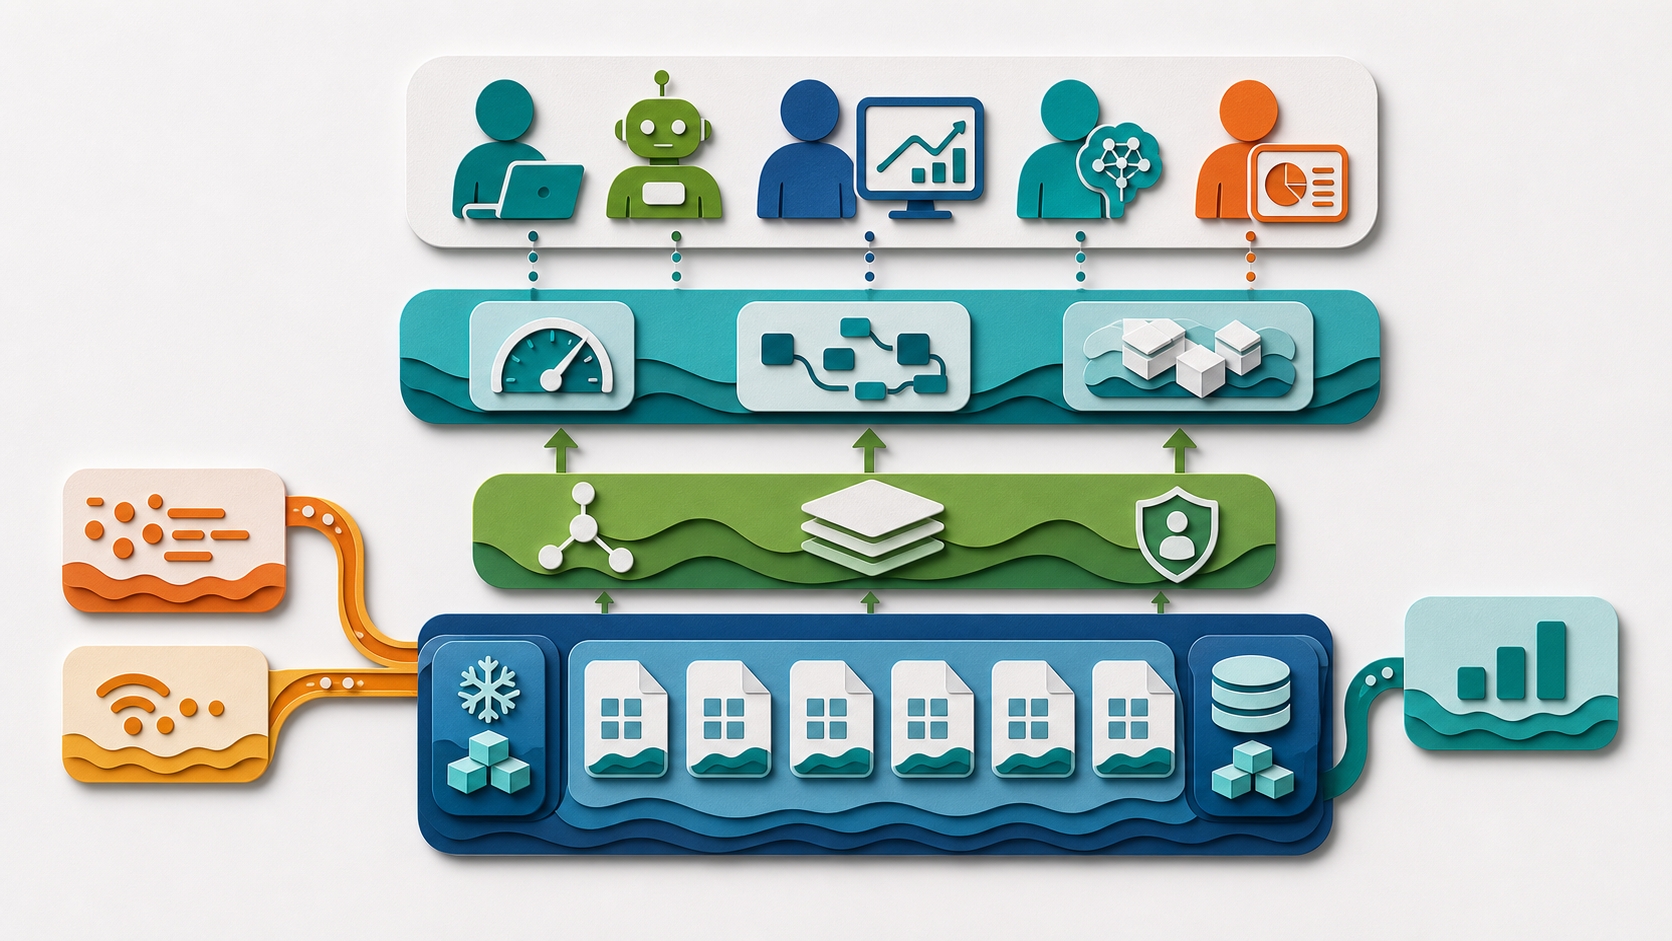
For this architecture, the five layers worth keeping distinct are storage, catalog, execution, semantics, and agent interface. Storage holds durable files and snapshots. The catalog resolves identity and access. The execution layer plans and runs work. The semantic layer gives business meaning. The agent interface controls which questions and actions are allowed.
The point is not to collapse those layers into one box. The point is to make the handoffs clear. If a user or agent asks for an answer, the platform should be able to explain which table, which snapshot, which definition, which identity, and which policy shaped the result.
A Production-Shaped Example
A practical design uses streaming SQL for immediate anomaly detection and Iceberg for durable historical state. The agent can look at a live signal, check recent committed data, validate the anomaly, and then decide whether to alert or act. That sequence is much safer than letting a model react to raw events without context.
The test should include a happy path and at least three failure paths. One failure should involve access. One should involve stale or incompatible data. One should involve an operational problem: a commit that stalls during high-ingestion load, a small-file accumulation that degrades query latency, or a streaming consumer that falls behind the watermark. Those failures are where the platform either earns trust or loses it.
The test should also produce evidence. Save event timestamps, snapshot IDs, commit latencies, and staleness warnings. If the team cannot find that evidence after the pilot, the rollout is not ready for a wider audience.
What To Measure
Start with four specific measurements:
- Event-time versus snapshot-time semantics defined and documented: Confirm that for each analytical query or agent tool, the team knows whether it is reading event time (when the event occurred) or snapshot time (when the commit became visible). Conflating these produces incorrect time-series analysis. Both are valid depending on the use case. Neither should be assumed.
- Commit frequency measured against small-file accumulation rate: Streaming ingestion that commits too frequently creates small files that degrade planning and scan performance. Streaming ingestion that commits too infrequently increases snapshot staleness. Measure both and find the commit interval that keeps file count manageable while meeting freshness requirements.
- Small-file accumulation tracked per partition per day: Confirm that there is a compaction schedule that prevents small-file count from growing unbounded on high-ingest partitions. Small-file pressure is the most common production problem in streaming-to-Iceberg pipelines. Track the file count before and after compaction runs.
- Alerting workloads separated from durable analysis workloads: Measure whether the streaming SQL path for immediate alerts shares compute resources with the Iceberg analytical path. If they share compute, measure the latency impact of each on the other. Immediate alerting that slows down because a large analytical query is running is a design gap.
Measurements should connect to decisions. A metric that nobody uses is telemetry decoration.
Common Failure Modes
The first mistake is treating the real-time lakehouse as a feature checklist. A checklist can confirm that streaming SQL and Iceberg are both present, but it rarely explains how they interact under production load. The better move is to write the operating contract. Name the freshness window, the commit frequency, the small-file accumulation limit, and the compaction schedule before claiming production readiness.
The second mistake is ignoring boundaries. Most streaming-to-Iceberg incidents appear at the boundary between the streaming ingestion layer and the table commit layer: the streaming job commits too frequently and creates thousands of small files, or the consumer falls behind the watermark and commits stale data. Boundary testing should be part of the rollout.
The third mistake is hiding tradeoffs behind category language. Saying "real-time lakehouse" is not a mechanic. What is the actual freshness window measured in minutes? What is the commit interval? What is the small-file count after a busy ingestion day? If the answers are vague, the design is still vague.
The most expensive failures are usually quiet. The streaming job commits every five seconds and creates 3,000 small files per hour on a busy partition. Query latency degrades over the course of a day, but nobody connects it to the commit frequency because the relationship is not documented. That is the most common silent failure in real-time lakehouse designs.
Guardrails for Agentic Use
Agents that use streaming data should start with tools that expose the durable Iceberg snapshot path, not the raw event stream. The Iceberg snapshot is governed, consistent, and queryable. The raw stream is not designed for analytical governance.
I would also require a visible freshness indicator on every agent tool that reads from a streaming-fed table. If the last snapshot is older than the defined freshness window, the agent should warn rather than return a number silently. A freshness warning is not a bad user experience. It is a trust feature.
Operational Checklist
| Area | Question to answer | Why it matters | |---|---|---| | Ownership | Who owns the streaming job, the table, and the compaction schedule? | Incidents need named owners, not shared confusion. | | Freshness | What is the defined freshness window for analytical queries? | A number in minutes is a contract. "Near real-time" is not. | | File Management | What is the commit interval and the compaction schedule? | Small-file accumulation degrades query latency over time. | | Evidence | Which snapshot IDs, commit timestamps, and staleness logs are saved? | Trust needs a trail. | | Rollback | What happens when a streaming commit fails or data arrives late? | Recovery is part of the design, not an afterthought. |
This checklist is intentionally plain. The hard part is not building a streaming pipeline. The hard part is defining freshness windows and managing small-file accumulation before production load reveals them.
What Engineers Should Verify
Engineers should verify exact engine versions, streaming framework versions, commit interval configuration, small-file accumulation rate, compaction schedule, and snapshot visibility rules. Claiming "real-time lakehouse support" is not enough. The team needs to know which ingestion volumes were tested, which commit intervals were validated, and which failure scenarios are explicitly handled.
The practical test is simple: can another engineer reproduce a high-ingestion scenario, measure the small-file count after two hours, verify the compaction schedule fired, and confirm the analytical query latency before and after? If not, the pipeline is not production-ready.
The setup should also be tested under realistic ingestion spikes. Many streaming-to-Iceberg pipelines perform correctly at steady state. They reveal small-file and compaction problems when ingestion rate doubles for a few hours.
What Data Owners Should Verify
Data owners should verify that the freshness window for analytical consumers matches the actual commit and compaction schedule. If a data owner said the table is fresh within five minutes, but the commit interval is thirty seconds and compaction runs every four hours, those numbers need to be reconciled before agent exposure.
This review should happen before agents are given access to streaming-fed tables. An agent that assumes five-minute freshness and gets data that is actually forty minutes old because a compaction job delayed the latest snapshot is operating on a false contract.
What Executives Should Hear
The summary should be plain: the real-time lakehouse is useful when streaming and historical analytics serve different parts of the business decision from the same open data foundation. It is risky when freshness is assumed rather than measured, or when small-file accumulation is left unmanaged.
The value is a unified data foundation that supports both immediate event-driven workflows and historical analytical depth. The limit is that the platform requires active management of commit frequency, compaction schedules, and freshness contracts. Those are engineering responsibilities that do not disappear because the platform is real-time.
A Good First Rollout
Start with one high-value event stream and one analytical use case. Define the freshness window in minutes. Define the commit interval. Define the compaction schedule. Test the pipeline under normal load and under a simulated ingestion spike.
Define success with three outcomes. The first is correctness: the analytical query always reflects data within the defined freshness window. The second is safety: small-file accumulation stays within the defined threshold between compaction runs. The third is operability: staleness warnings appear correctly when the freshness window is breached.
After that, expand to another stream or another analytical use case. Expanding one dimension at a time is slower than a sweeping rollout, but it creates fewer freshness surprises.
Deeper Design Notes
The design work should begin with the two clocks: event time and snapshot time. Name the tables, the streaming jobs that feed them, the commit intervals, the compaction schedules, the freshness windows, and the analytical paths that read from each snapshot. When those are vague, every later discussion becomes vague too. Start with the concrete timings and build outward.
The next step is to define the dimensions that actually change behavior: event time, snapshot time, commit frequency, file layout, compaction schedule, and freshness window. These are not decorative details. They determine whether the streaming-to-Iceberg pipeline is predictable under real load.
Review Questions Worth Asking
The first question is simple: what is the commit interval for each streaming job that writes to Iceberg? If the answer is "as frequent as possible," the small-file risk is not managed.
The second question: what is the small-file count after a peak ingestion day, and when does compaction run to address it? If those two numbers are not connected to each other, the file management design is incomplete.
The third question: who gets notified when the freshness window is breached because a streaming consumer fell behind? If the answer is unclear, the monitoring is not ready.
A Realistic Pilot Shape
A realistic pilot should look like an anomaly workflow that checks live events against recently committed historical state. That scenario is narrow enough to test and broad enough to reveal freshness and file management problems. It should include one clean check, one check where the latest snapshot is stale beyond the freshness window, one check during a small-file accumulation spike, and one check where the streaming consumer is behind the watermark. The point is not to make the pilot impressive. The point is to make it diagnostic.
Include a repetition test. Run the same pipeline across several days with varying ingestion rates. Many streaming-to-Iceberg designs work correctly at steady-state volume. They reveal file management and freshness problems when ingestion spikes.
Metrics That Should Drive the Next Decision
The first metrics to watch are event delay versus snapshot visibility delay, commit interval versus small-file accumulation rate, compaction effectiveness, and freshness-window breach frequency. Those measurements should lead to a decision about whether to adjust commit frequency, change the compaction schedule, or split the alerting and analytical workloads.
A second group of metrics should track query performance: how does analytical query latency change as small-file count grows between compaction runs? That relationship tells you how often compaction needs to run.
A third group should track cost: how much does the commit frequency and compaction schedule cost in object storage API calls and compute? Real-time freshness has a cost. Track it.
What I Would Cut From a Weak Rollout
Cut shared compute between immediate alerting and analytical queries from the first phase. If one workload slows the other, it is much harder to diagnose the root cause. Start with dedicated compute for each workload type.
Cut commit intervals below thirty seconds from the initial configuration. Very frequent commits create very small files. Start with a commit interval that keeps file size above a reasonable minimum (say 64MB on average) and tune from there.
Cut multi-stream ingestion from the first phase. One stream, one table, one freshness contract. Add more streams after the first one is production-stable.
The Practical Standard
The practical standard is not the fastest possible commit interval. It is manageable file health and consistent freshness within the defined window. When a dashboard consumer challenges whether the data is fresh, the operator should be able to pull up the snapshot ID, the commit timestamp, and the last compaction run without searching through logs.
That standard is demanding, but it is realistic. It lets teams build real-time lakehouse pipelines without pretending that streaming engines eliminate the need for file management and freshness discipline.
My Recommendation
Take the real-time lakehouse seriously, but do not oversell it. The useful bar is simple: can the team define the freshness window, manage small-file accumulation, separate alerting from analytical workloads, and recover from streaming failures?
If the answer is yes, the pattern deserves a production pilot. If the answer is no, the next step is not a faster streaming engine. The next step is a clearer contract between event time and snapshot time.
Dremio fits the real-time lakehouse when teams need fast governed SQL over durable open data and semantic context for analytical agents. It does not need to own every streaming component to be useful in the architecture. The governed SQL layer that Dremio provides is the analytical half of the real-time design: the durable, queryable, semantically-governed surface that streaming data becomes once it is committed to Iceberg.
For a deeper foundation on lakehouse and AI architecture, explore Alex Merced's books on data lakehouses and AI at books.alexmerced.com. To try a governed, open, agent-ready lakehouse in practice, start a free trial of Dremio's Agentic Lakehouse at dremio.com/get-started.