Iceberg v4 Performance: Root Manifests and Calls
Apache Iceberg v4 discussion should focus on planning cost, metadata layout, and object storage round trips, not vague claims about faster tables. For platform engineers running Iceberg on S3, ADLS, or GCS, the useful question is what changes in production and what simply sounds current.
Why Metadata Round Trips Matter More Than Scan Speed
A dashboard query that scans only one partition can still wait on multiple metadata requests before it reaches useful Parquet reads.
I look at this through a simple production lens: what becomes clearer, safer, faster, or easier to operate once the pattern is real? That matters because query latency for Iceberg tables is often a planning problem, not a scan problem. The scan is fast. The metadata path before it is where latency accumulates.
That does not mean every data platform needs to be rebuilt around new spec versions. What it does mean is that teams should understand what they are actually measuring before attributing improvements to a specific Iceberg version or feature.
What the Specs Support
The strongest public sources for this topic are the Apache Iceberg specification, the Apache Iceberg REST catalog specification, and Apache Iceberg releases. I use those to ground the architecture and avoid treating every June 2026 announcement as a shipped production capability.
The evidence supports a few grounded points:
- Object storage latency makes serial metadata reads expensive for interactive workloads.
- Root manifest and call-combining ideas should be discussed as design direction unless they appear in a released specification.
- Planning performance depends on catalog behavior, metadata layout, file counts, partition design, and engine implementation.
That is enough to write a useful technical article. It is not enough to make sweeping claims. I separate released behavior, design direction, and market language because readers can work with careful distinctions. They cannot operate slogans.
The Architecture Pattern
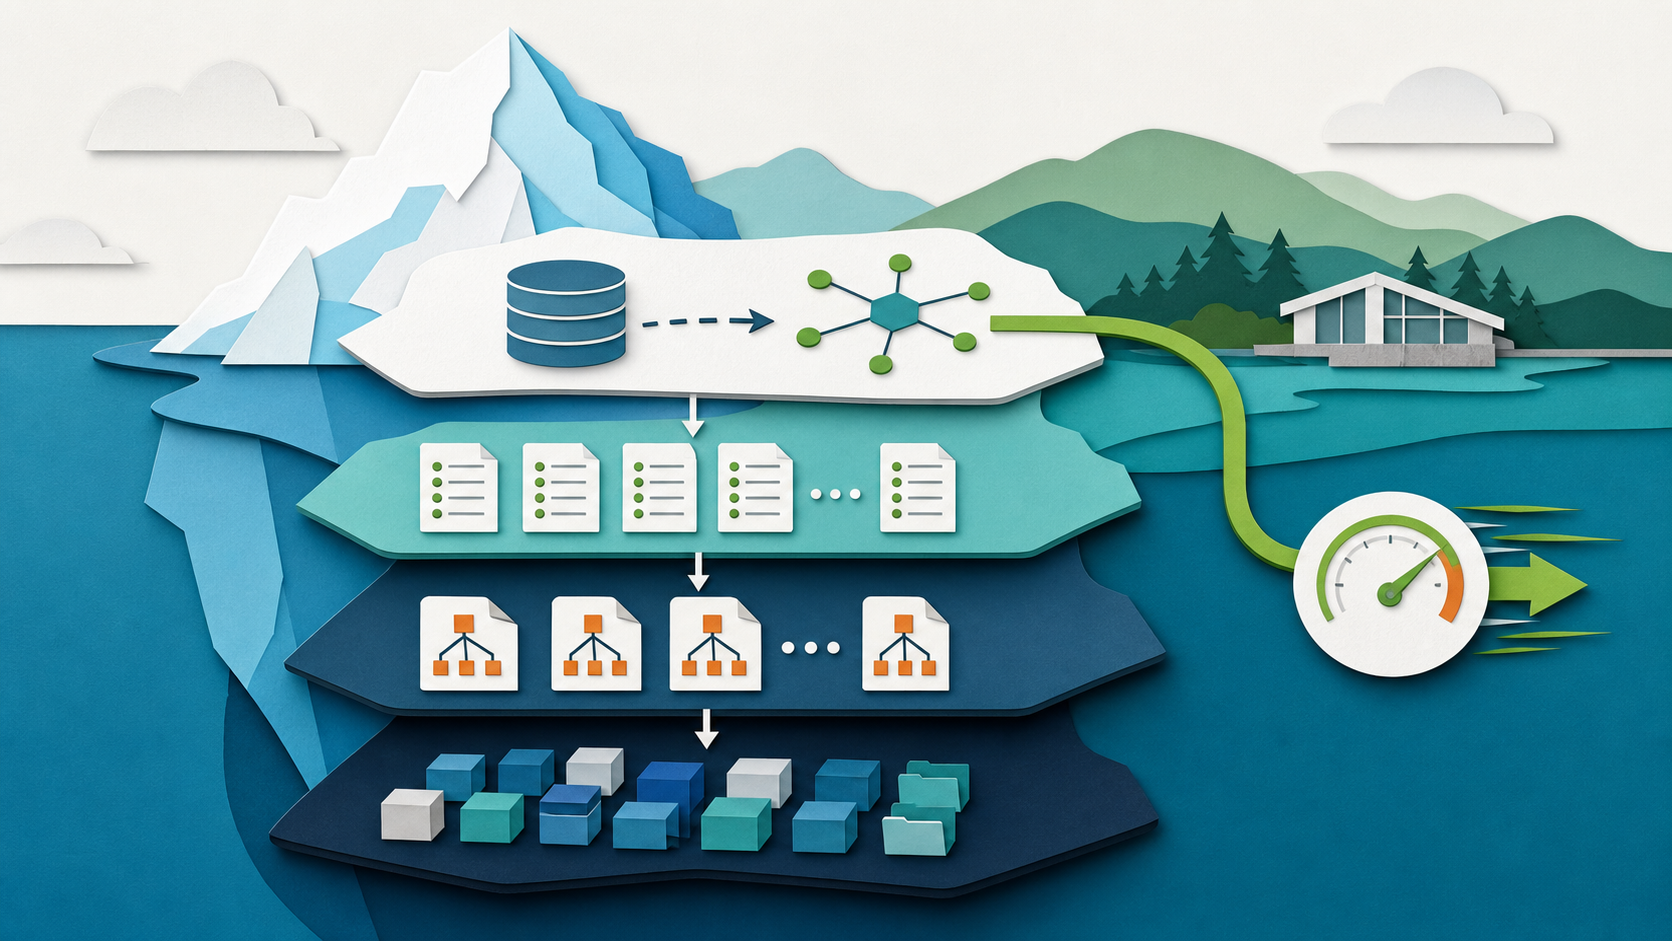
The important path starts before the scan. A client resolves the table in the catalog, reads the current metadata pointer, discovers manifests and manifest lists, prunes partitions and files, and only then turns the query into useful Parquet reads. If each step waits on another network round trip, a small query can feel large. The table format may be efficient on paper while the user still experiences latency in the planning path.
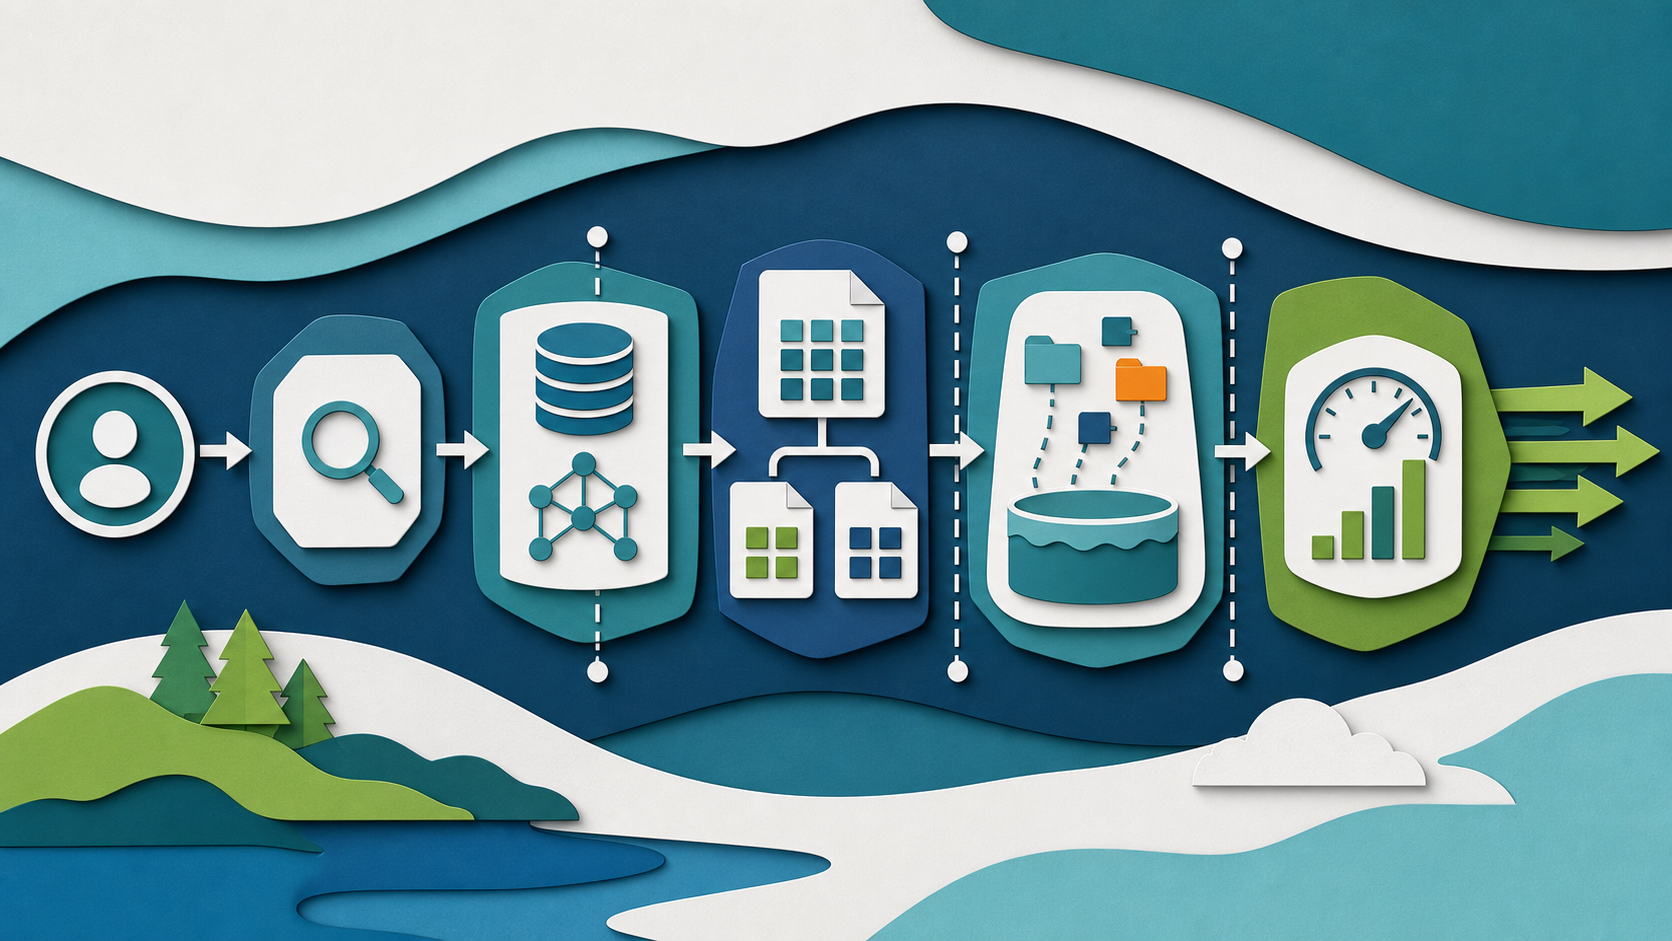
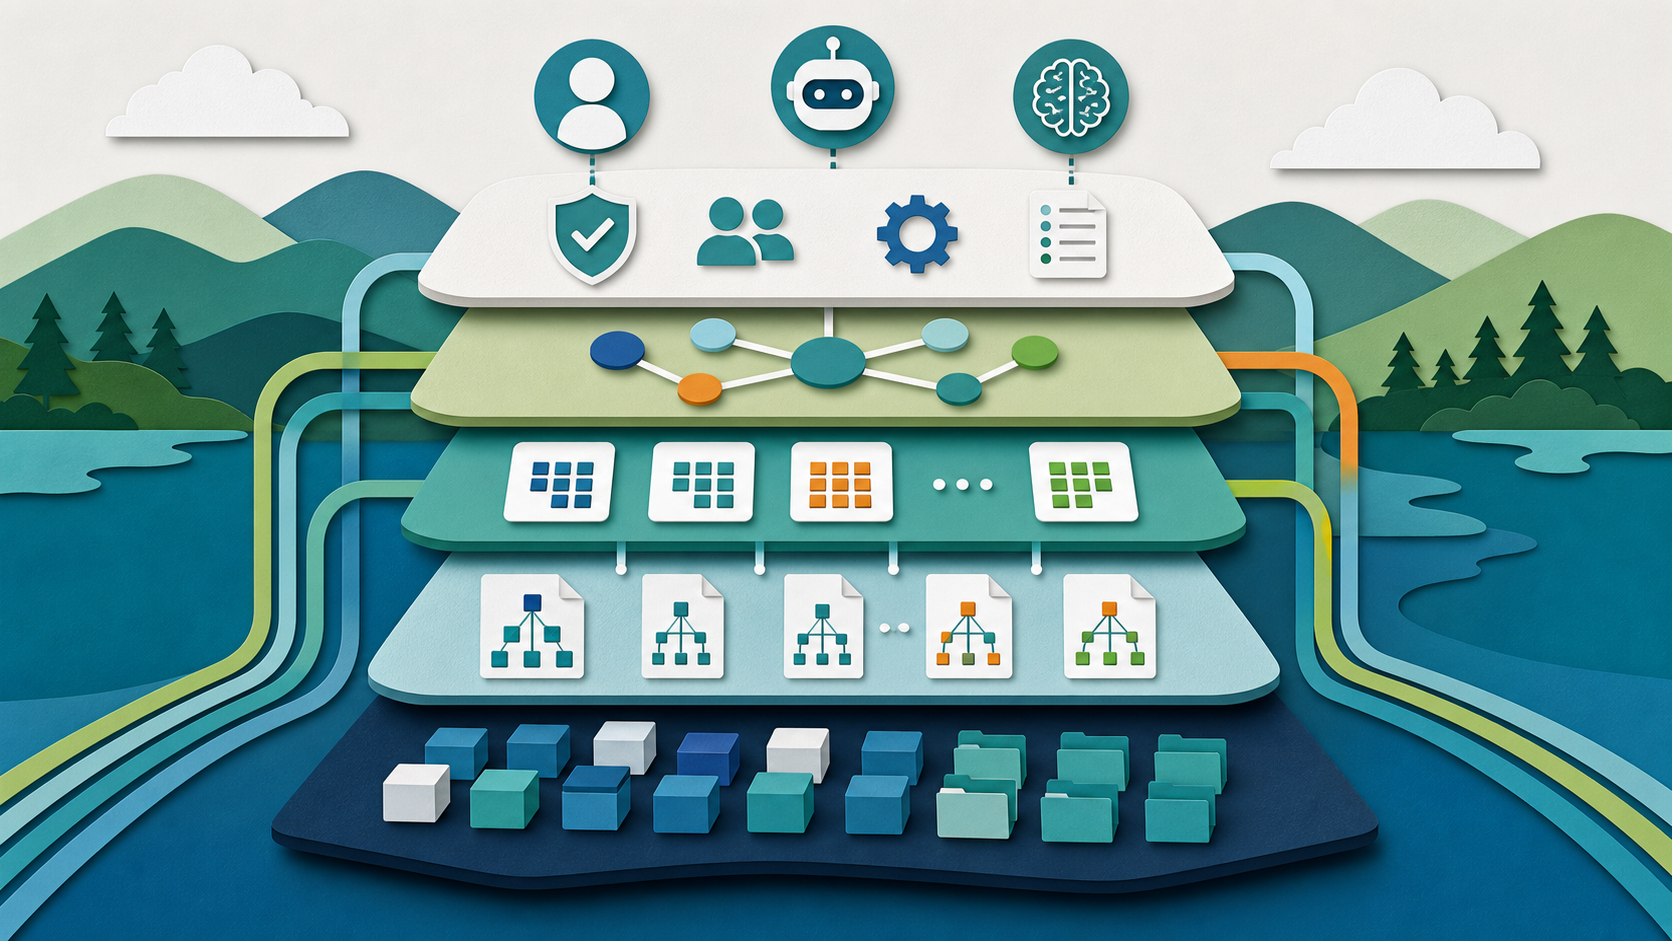
For this architecture, the five layers worth keeping distinct are storage, catalog, execution, semantics, and agent interface. Storage holds durable files and snapshots. The catalog resolves identity and access. The execution layer plans and runs work. The semantic layer gives business meaning. The agent interface controls which questions and actions are allowed.
The point is not to collapse those layers into one box. The point is to make the handoffs clear. If a user or agent asks for an answer, the platform should be able to explain which table, which snapshot, which definition, which identity, and which policy shaped the result.
A Production-Shaped Example
Test this with two tables that contain the same logical data but different metadata shapes. One table should have many small files and a long snapshot history. The other should be maintained with cleaner manifests and predictable partitioning. Run the same selective query, separate planning time from scan time, then repeat through the catalog path your production users actually use.
The test should include a happy path and at least three failure paths. One failure should involve access. One should involve stale or incompatible data. One should involve an operational problem: retry behavior, catalog latency, or unsupported engine behavior. Those failures are where the platform either earns trust or loses it.
The test should also produce evidence. Save query IDs, snapshot IDs, planning time breakdowns, and object storage request counts. If the team cannot find that evidence after the pilot, the measurement is not ready for production decisions.
What To Measure
Start with four specific measurements:
- Planning latency separated from scan latency: A query profile that only shows total elapsed time is not useful for diagnosing metadata problems. Separate the time spent on catalog resolution, manifest reads, file pruning, and actual Parquet scan. Many "slow query" reports are really "slow planning" reports in disguise.
- Metadata object requests per query: Count the number of object storage requests the planning path makes before the first data file is read. On S3 or ADLS, each request adds latency. A table with deeply nested manifests and long snapshot history can generate dozens of requests before reading a single row.
- Cold versus warm catalog path comparison: The first query against a table in a session often behaves very differently from subsequent queries. Warm cache effects can make planning look fast during demos. Test cold paths to understand actual user experience after a session reset or a new client.
- Engine version and table format behavior recorded together: Iceberg planning behavior depends on both the table format version and the engine version. A measurement without both recorded is not reproducible. Always note which engine client, which catalog implementation, and which spec version were in play.
Measurements should connect to decisions. If planning latency crosses a threshold, decide whether to optimize metadata, improve partitioning, add acceleration, or switch to a warmer catalog path.
Common Failure Modes
The first mistake is treating Iceberg performance as a feature checklist. A checklist can confirm that a capability exists, but it rarely explains how the capability behaves under pressure. The better move is to write the operating contract. Name the table, the catalog, the engine version, the expected metadata layout, and the planning latency target before making a version upgrade decision.
The second mistake is ignoring boundaries. Most planning performance problems appear at boundaries: catalog to engine, metadata to file discovery, or partition pruning to actual scan. Boundary testing should be part of the investigation. If only the happy path was profiled, the team has not found the actual bottleneck.
The third mistake is hiding tradeoffs behind version language. Saying "Iceberg v4 is faster" is not a mechanic. The useful claim is: under this catalog, this engine, and this table shape, these specific operations improved by this amount because this metadata path was shortened. If the answer is vague, the measurement is still vague.
The most expensive failures are usually quiet. The query succeeds, but it always takes four seconds for a selective dashboard query because the manifest path is long. Nobody investigates because it is consistent and below the timeout threshold. That is where planning cost hides.
Guardrails for Agentic Use
Agents that query large Iceberg tables should use certified views or narrow tools that expose only well-maintained, properly partitioned tables. They should not receive broad table discovery that lets them query tables with long snapshot histories or unmanaged metadata.
I would also require a visible latency contract on agent tools. A tool that queries a high-cardinality table should document its planning latency expectations. If planning time exceeds the contract, the tool should warn or fall back to an accelerated view. Silent slow queries are a trust problem.
Operational Checklist
| Area | Question to answer | Why it matters | |---|---|---| | Ownership | Who owns the table and its maintenance schedule? | Metadata health requires active ownership. | | Scope | Which tables are included in the performance optimization effort? | A narrow scope is easier to profile and tune. | | Engine | Which engine version and catalog implementation are in use? | Planning behavior is engine and catalog specific. | | Evidence | Which planning profiles and request counts are saved? | Optimization decisions need baseline measurements. | | Rollback | What happens when a spec upgrade causes unexpected behavior? | Recovery from spec changes requires a test path. |
This checklist is intentionally plain. The hard part is not the version upgrade. The hard part is knowing which measurements to collect before and after.
What Engineers Should Verify
Engineers should verify exact engine versions, catalog implementations, table format versions, metadata object counts, and planning time breakdowns. Claiming "improved Iceberg performance" is not enough. The team needs to know which planning path changed, which tables benefited, and which workloads were outside the improvement scope.
The practical test is simple: can another engineer reproduce the performance profile using only the documented table, catalog, and engine configuration? If not, the measurement is not reproducible.
The setup should also be tested under realistic concurrency. Metadata planning under a single query load behaves differently from planning under concurrent dashboard users, agent queries, and batch ingestion. Production readiness is about the second case.
What Data Owners Should Verify
Data owners should verify that table maintenance is active and that retention and snapshot policies are defined. A table with two years of unmanaged snapshots will have a long metadata path regardless of spec version. Planning performance improvements from format changes are smaller than improvements from proper table maintenance.
This review should happen before attributing slow queries to the format version. Many teams upgrade their Iceberg version looking for a performance fix when the actual problem is a table with thousands of small files and no compaction schedule.
What Executives Should Hear
The summary should be plain: Iceberg v4 performance improvements are valuable when they reduce planning latency for interactive workloads, especially under concurrent query load. They are limited when the actual bottleneck is table maintenance, catalog implementation, or engine behavior, not the table format version.
The value is faster interactive queries over open data. The limit is that format version is one variable among several. Teams that profile only the format version and not the full planning path will draw incorrect conclusions.
A Good First Rollout
Start with one high-traffic table and profile its planning path in detail. Separate catalog resolution time, manifest read time, file pruning time, and actual scan time. Understand the baseline. Then apply one change: better maintenance, cleaner partitioning, or a spec upgrade. Measure again. The goal is to know which change produced which result.
Define success with three outcomes. The first is measurable planning latency reduction on the profiled table. The second is reproducible: another engineer can run the same profile and get the same result. The third is safe: the change did not affect data correctness or snapshot integrity.
After that, expand to other tables. Expanding one table at a time is slower than a sweeping upgrade, but it creates fewer surprises.
Deeper Design Notes
The design work should begin with the nouns in the planning path. Name the table, the catalog endpoint, the manifest count, the snapshot history depth, the engine client version, and the object storage service. When those nouns are vague, every later discussion becomes vague too. A team can spend weeks debating format versions while still failing to say how many object storage requests a single dashboard query makes. Start with the concrete measurement and build outward.
The next step is to define the dimensions that actually change behavior: metadata round trips, manifest organization, catalog latency, file pruning ratio. These are the real levers. Format version may affect some of them. Table maintenance affects most of them.
Review Questions Worth Asking
The first question is simple: what is the current planning latency for the five highest-traffic tables? If nobody knows, the team is not ready to optimize. Optimization without a baseline is guesswork.
The second question: how many object storage requests does a typical dashboard query make before reading the first data file? If the answer is more than ten, the metadata layout is worth examining regardless of spec version.
The third question: what is the snapshot history depth for the highest-traffic tables? Long snapshot histories make manifest lists larger and planning slower. Snapshot expiration is often the most impactful maintenance task for planning performance.
A Realistic Pilot Shape
A realistic pilot should look like a selective dashboard query that touches a small slice of a very large table with a long snapshot history. Profile planning time, object request count, and file pruning ratio. Apply one change: snapshot expiration, compaction, or partition improvement. Profile again. Compare.
Include a repetition test. Run the same profile across a few days of normal ingestion. Planning performance can degrade gradually as snapshot count and small file count grow. Many systems profile well immediately after maintenance. Fewer stay fast through normal operational cycles.
Metrics That Should Drive the Next Decision
The first metrics to watch are planning time, metadata object request count, manifest scan time, and file pruning ratio. Those measurements should lead to a decision about whether to apply table maintenance, change partition strategy, apply a spec upgrade, or add acceleration. If the team cannot name the decision connected to a metric, the metric is probably not useful yet.
A second group of metrics should track cost: how much does it cost per query in object storage request charges? Metadata-heavy workloads can have surprising storage API costs that do not show up in compute costs.
A third group should track stability: does planning latency stay consistent after a maintenance operation, or does it degrade within a week? If it degrades quickly, the maintenance frequency is too low.
What I Would Cut From a Weak Investigation
Cut vague version claims first. Do not start with "Iceberg v4 is faster." Start with a profiled baseline and a specific planning path problem.
Cut concurrent load from the initial measurement. Profile one query at a time first. Add concurrent load testing after the single-query behavior is understood.
Cut unsupported engine versions from the upgrade path. Some engines implement newer spec features and some do not. Verify engine support before attributing planning changes to a format version.
The Practical Standard
The practical standard is not maximum speed. It is reproducible measurement under realistic load. When a user challenges the latency of a dashboard query, an operator should be able to explain how many metadata requests the planning path made, which manifest path was used, and which maintenance operations are scheduled to keep that count manageable.
That standard is demanding, but it is realistic. It lets teams make confident claims about Iceberg performance improvements without overstating what a format version change can deliver.
My Recommendation
Take Iceberg performance seriously, but do not oversell specific version claims. The useful bar is simple: can the team measure planning latency, identify the bottleneck, apply a targeted change, and verify improvement with evidence?
If the answer is yes, the investigation is proceeding correctly. If the answer is no, the next step is not a version upgrade. The next step is a proper planning profile.
Open table performance should be discussed above the file layer. Platforms like Dremio are relevant when teams want fast SQL over open Iceberg tables, acceleration for repeated patterns, and semantic context for users and agents. The argument should start with the measurable planning path rather than a vendor claim, because the planning path is where the user actually experiences latency.
For a deeper foundation on lakehouse and AI architecture, explore Alex Merced's books on data lakehouses and AI at books.alexmerced.com. To try a governed, open, agent-ready lakehouse in practice, start a free trial of Dremio's Agentic Lakehouse at dremio.com/get-started.